
You open the sleep graph on your Apple Watch or in the Health app on your iPhone, and it’s a row of colored bars, broken up into little pieces. Was that a good night or a bad one? What does a normal sleep graph look like, and how does yours compare? This article is for you if you’ve wondered the same.
The short answer: a typical healthy adult’s sleep graph looks like a series of waves, with cycles of about 90 minutes repeating 4 to 6 times a night, Deep sleep mostly in the first half, and REM periods getting longer toward morning. Core is usually the longest stage, and brief awakenings scattered through the night are normal. Real Apple Watch graphs are much choppier than the textbook picture and change from night to night, so rather than comparing one night with an “ideal” shape, it’s more useful to line up many nights and learn what your own normal looks like. This article covers what a typical graph looks like, why real graphs look different, which patterns are worth a closer look, and how to read your graph day to day.
About this article
This article is written by Masa, an engineer and co-founder of Medisense Inc., the company that develops the sleep app Sleepa. Medisense is led by a physician who specializes in sleep (why we built Sleepa). For what Awake, REM, Core and Deep each mean, see How to read your Apple Watch sleep data.
What does the Apple Watch sleep graph show?
The Apple Watch sleep graph shows your night in time order, split into four states: Awake, REM, Core and Deep. According to Apple’s paper, Apple Watch uses its accelerometer to pick up wrist movement (including the small movements caused by breathing) and classifies every 30 seconds into one of those four states. It doesn’t measure brain waves, so the graph is an estimate.
You can find your sleep graph in two places:
- The Health app on iPhone: tap the Browse tab, then Sleep. The chart opens in daily view (D). Tap W, M or 6M at the top to see the past week, month or 6 months. Tap Show More Sleep Data, then Stages, to see the time and percentage you spent Awake or in REM, Core or Deep sleep.
- The Sleep app on Apple Watch: open the app and turn the Digital Crown to see your Sleep Stages data, Time Asleep and Sleep Duration for the last 14 days.
What does a normal sleep graph look like?
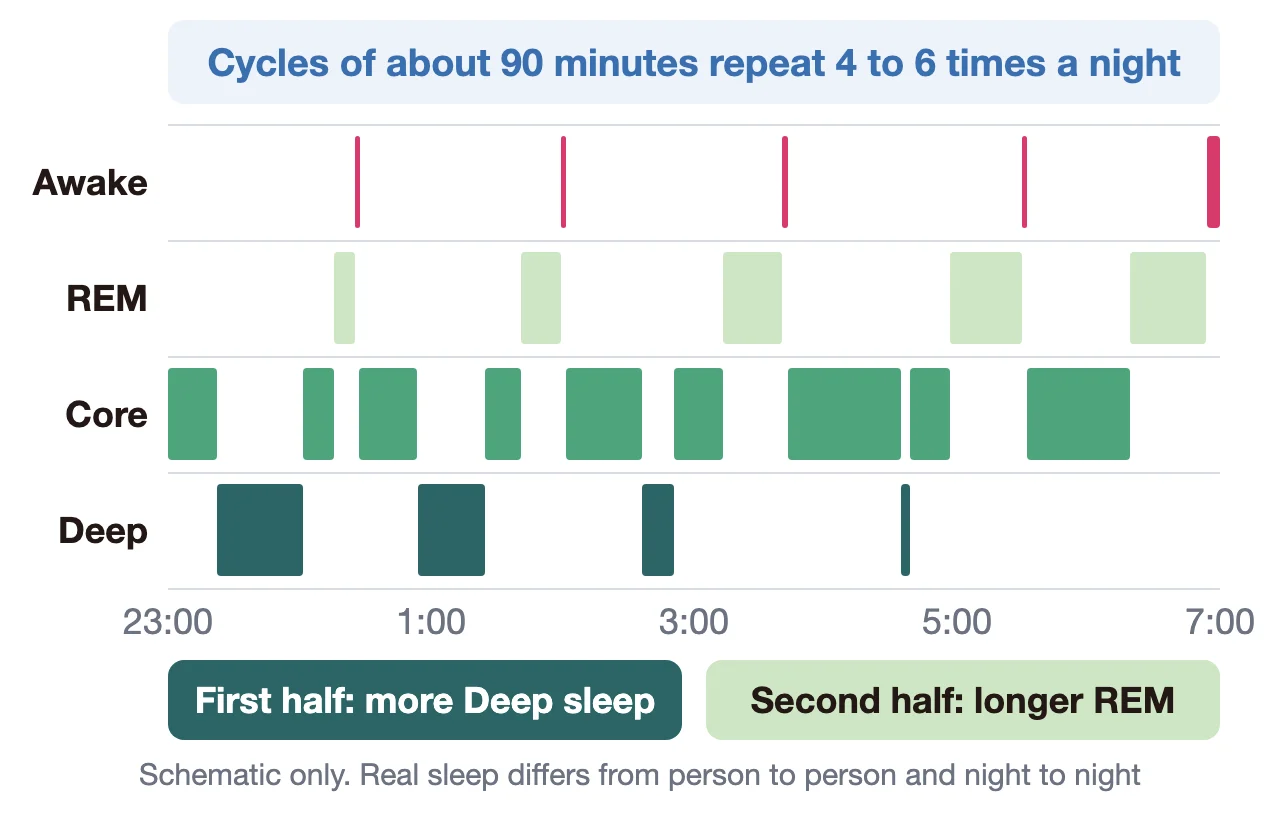
A normal sleep graph, meaning the typical night of a healthy adult, looks like a series of waves as you cycle between non-REM and REM sleep. According to StatPearls, a medical reference, the body cycles through all the stages about 4 to 6 times a night, with each cycle lasting about 90 minutes on average. The table below sums up what a typical night looks like.
| What to look at | Typical pattern |
|---|---|
| Overall | Cycles of about 90 minutes, repeated 4 to 6 times |
| Deep | Mostly in the first half of the night, less in the second half |
| REM | First appears about 90 minutes after falling asleep, and gets longer toward morning |
| Core | The longest of the four |
| Awake | A few brief awakenings scattered through the night |
Deep sleep comes early, REM comes late
According to the National Institute of Neurological Disorders and Stroke (NINDS), deep sleep (stage 3 non-REM sleep) occurs in longer periods during the first half of the night. REM sleep first occurs about 90 minutes after you fall asleep, and REM periods get longer as the night goes on. StatPearls says the first REM period typically lasts about 10 minutes, while the last can last up to an hour. It also notes that people tend to wake up naturally in the morning during a REM period.
So on a typical graph, Deep shows up in blocks early in the night, then thins out, while the REM bars get longer toward morning.
Core is the longest stage
Core on Apple Watch corresponds to stage N2 (plus a little N1) in the medical classification of sleep. Apple’s paper describes N2 as the predominant stage, often making up more than half of a night’s sleep, and as a normal and important part of sleep. In the people who took part in Apple’s validation study (average age 47, 166 people), sleep lab tests found that Core made up about 66% of their sleep. So it’s normal for Core to fill most of your graph (see lots of Core sleep on your Apple Watch?).
Brief awakenings are normal
Brief awakenings are common in normal sleep. Apple’s paper notes that they are common in normal sleep but may go unrecognized by the sleeper. In the same study, participants spent an average of about 35 minutes awake after first falling asleep. A few thin Awake lines on your graph don’t, on their own, mean you slept badly (see Lots of “Awake” in your Apple Watch sleep data?).
For typical percentages for each stage (Core about 55%, Deep about 20%, REM 20 to 25%) and how much they vary, see How much of each sleep stage is normal on Apple Watch?
Why doesn’t my graph look like the textbook picture?
Real Apple Watch sleep graphs are usually much choppier than the schematic and look different from night to night. There are four main reasons:
- A decision every 30 seconds: Apple Watch classifies each 30-second window, so even brief switches between stages show up as thin bars or lines.
- Estimation error: according to Apple’s paper, the most common mismatch with sleep lab tests is true Deep sleep being classified as Core. That can make Deep look thinner and shorter than it really is (see Not much Deep sleep on your Apple Watch?).
- Night-to-night changes: Apple’s paper says alcohol, caffeine, exercise, stress and an inconsistent schedule can all influence the timing, length and stages of your sleep.
- Age: a meta-analysis of studies in healthy people found that, as adults get older, the share of deep sleep and REM sleep goes down and time awake during the night goes up.
Here’s what real data looks like. The screens below show two nights from the same person in Sleepa. The rows are Awake (red), REM (light green), Core (green) and Deep (dark green), and the blue dots show blood oxygen.
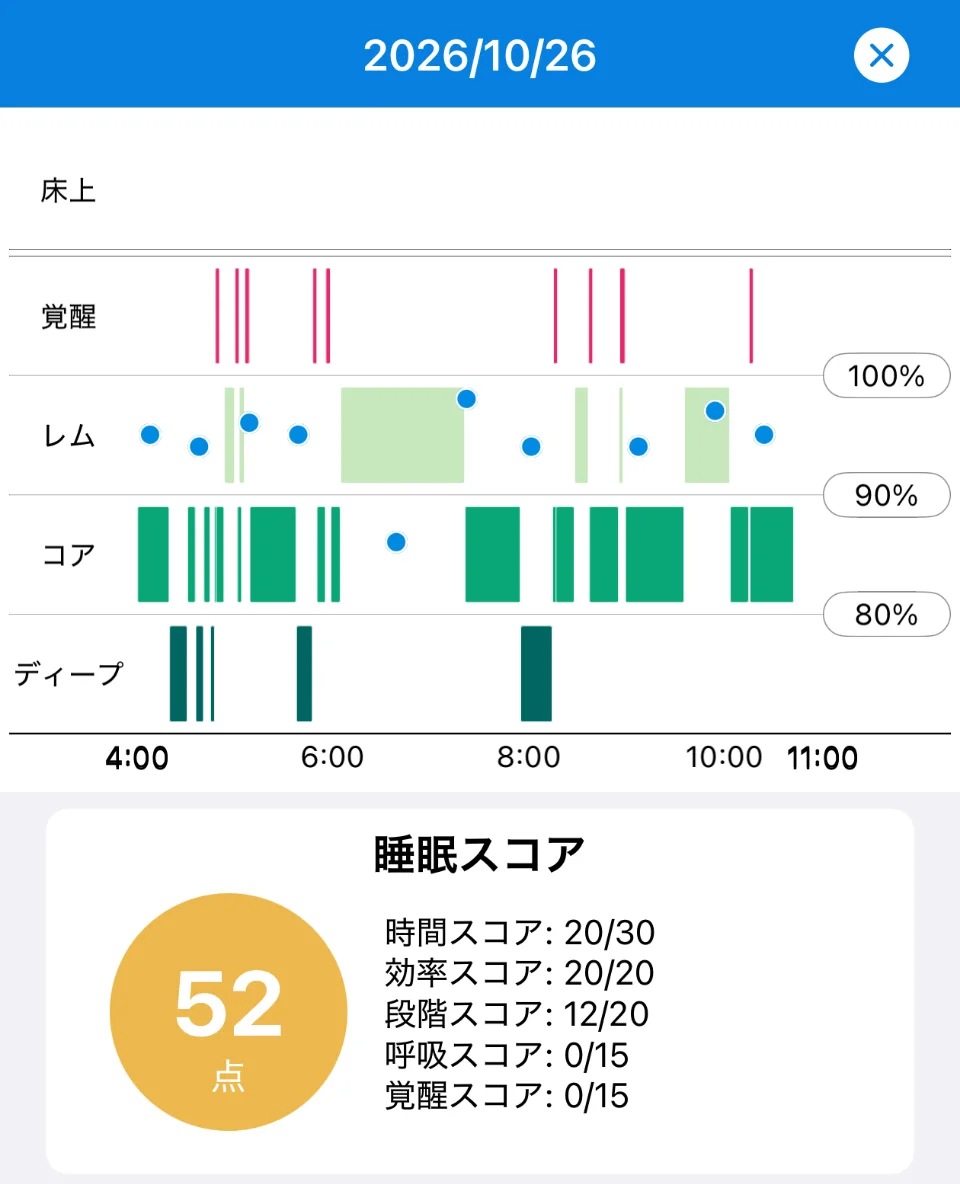
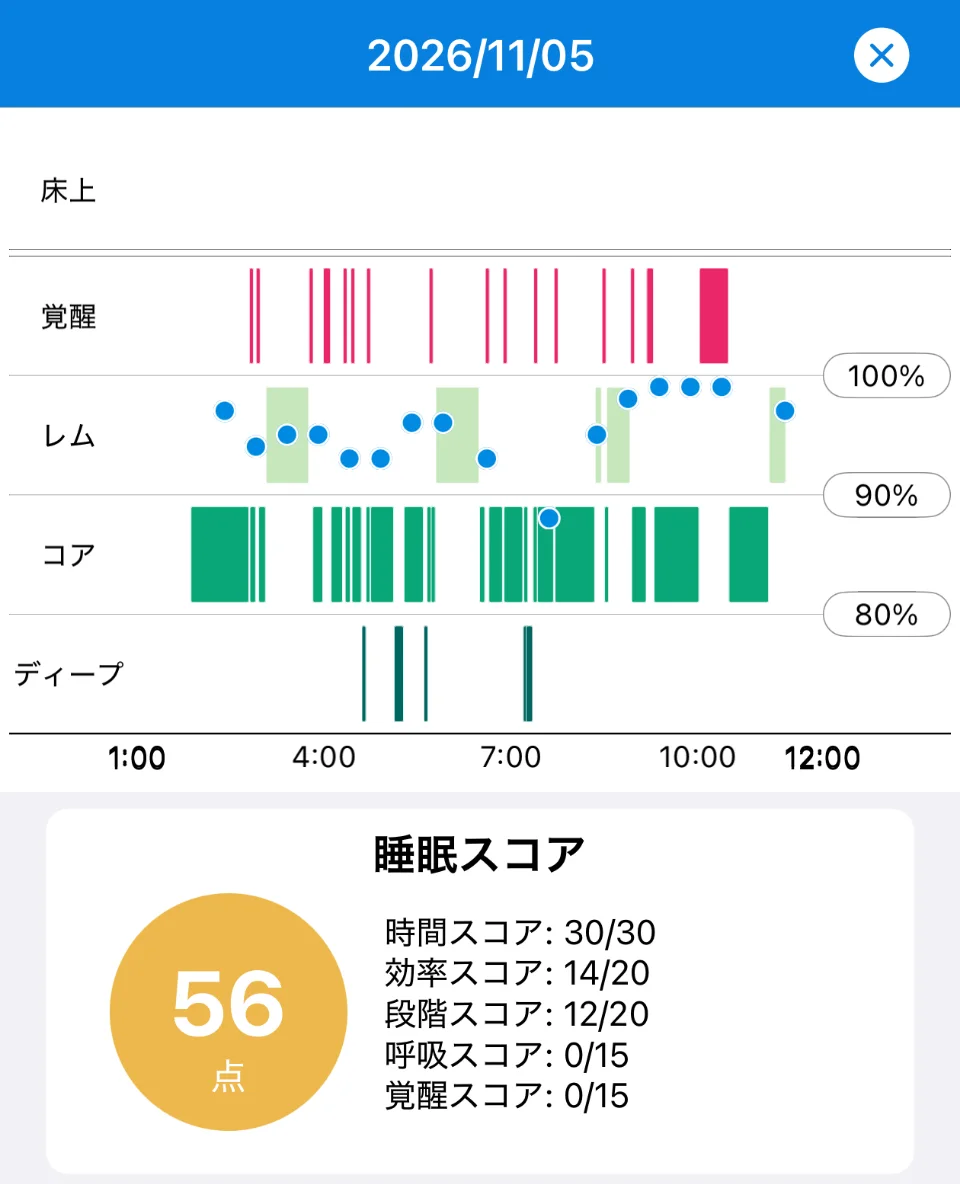
Sleepa is available in English, but some screens are still shown in Japanese. The screenshots in this article show the Japanese version.
- October 26 (4:00 to 11:00): Deep shows up several times in the first two hours or so, and once more around 8:00. The longest REM bar runs from about 6:00 to just after 7:00, so REM doesn’t neatly get longer toward the end of the night as in the schematic. Thin Awake lines are scattered through the night.
- November 5 (1:00 to 12:00): Deep appears only as a few thin lines, with no solid block. There are more than a dozen thin Awake lines, plus a thick bar (a long awakening) around 10:00. REM appears several times, spaced apart.
Neither night is as tidy as the schematic. Thin Awake lines and REM in unexpected places are common on real graphs. What’s worth watching is not these small details but patterns that repeat night after night, described in the next section. Even a night with almost no Deep, like November 5, or a long awakening in the morning shouldn’t be judged on its own. Compare it with your other nights.
Which patterns are worth a closer look?
A sleep graph that doesn’t match the typical shape is nothing unusual, but if one of the following patterns keeps showing up night after night, use it as a prompt to check your recording and your sleep routine. None of them, on its own, means something is wrong.
| Pattern on the graph | What to check first |
|---|---|
| The graph is short overall | Whether recording stopped partway, and whether you’re leaving enough time for sleep |
| A long Awake stretch at the start or toward morning | How many nights a week this happens, and for how many weeks |
| The graph sits at very different times from day to day | How much your bedtime and wake time vary (weekdays vs. days off) |
| Almost no Deep or REM | Estimation error, age, how long you slept, alcohol before bed |
| Lots of awakenings, broken-up sleep | Whether there are long awakenings, alcohol or caffeine before bed, how you feel during the day |
Short total sleep
If the graph is short from start to finish, first check whether recording stopped partway through the night. If you took your Apple Watch off during the night or the battery ran out while you slept, your sleep time will be recorded as shorter than it was. Apple recommends charging your watch to at least 30% before bed (see Apple Watch sleep tracking not working?).
If the data is right and short nights keep coming, look at how much time you leave for sleep. A joint consensus statement from the American Academy of Sleep Medicine and the Sleep Research Society recommends that adults aged 18 to 60 sleep 7 or more hours a night. Japan’s Ministry of Health, Labour and Welfare, noting that people need different amounts of sleep, suggests at least 6 hours. And because REM periods get longer toward morning, a short night means waking up before the longer REM periods arrive.
A long Awake stretch at bedtime or toward morning
This is a night with a thick Awake bar near the start or the end of the graph. Nights when it took a long time to fall asleep, or when you woke up early and couldn’t get back to sleep, look like this. In a sleep lab test, the American Thoracic Society’s guide to sleep study reports treats falling asleep in under 30 minutes as normal.
Keep in mind that Apple Watch can record time spent lying still but awake as sleep. Apple says that with watchOS 26 it improved the detection of this “quiet wake,” which often happens just before or after sleep. A single night like this often has a simple reason, such as something on your mind or going to bed earlier than usual. What’s worth watching is whether it happens several nights a week, for weeks (see Lots of “Awake” in your Apple Watch sleep data?).
Bedtime or wake time very different from usual
Even if the shape looks fine, check whether the graph’s position, meaning when you fell asleep and woke up, shifts a lot from day to day. Apple’s own Sleep Score includes bedtime consistency (30 points), which considers when you fell asleep over the last 13 nights. Japan’s Ministry of Health, Labour and Welfare notes that sleeping in on days off, with a much later wake time, throws off your body clock and causes jet lag much like international travel (sometimes called social jet lag). Comparing where the graph sits on weekdays and days off makes this easy to spot.
Almost no Deep or REM sleep
If you can barely see any Deep or REM on your graph, check the following:
- Estimation error: the most common mistake Apple Watch makes is classifying true Deep sleep as Core. Seeing little Deep doesn’t necessarily mean you had little.
- Age: in adults, the share of deep sleep and REM sleep goes down with age. There’s no need to compare your graph with your younger self or with other people.
- How long you slept: REM periods get longer toward morning, so short nights tend to have less REM.
- Alcohol before bed: a review of studies on alcohol and sleep found that alcohol delays the first REM period, and that at moderate and high doses it lowers the share of REM over the whole night.
On the other hand, some nights may look like they’re mostly Deep sleep. Because Deep comes mostly in the first half of the night, a short night can make its share look bigger. The same review also found that on nights with alcohol, deep sleep increases in the first half of the night and sleep becomes more disrupted in the second half. Either way, don’t judge from a single night. Check whether it keeps happening (see Not much Deep sleep on your Apple Watch?).
Lots of awakenings, broken-up sleep
This is a night with many thin Awake lines, where the other stages are chopped into short pieces too. Apple Watch records even brief awakenings you don’t remember, so lots of thin lines are not unusual in themselves. What’s worth watching is whether there are long awakenings (thick bars) most nights, and how you feel during the day. Alcohol before bed tends to disrupt the second half of the night, and one study found that caffeine taken even 6 hours before bed disrupted sleep.
If someone has told you that you snore loudly or stop breathing in your sleep, see a doctor whatever your graph looks like.
How should you read your sleep graph?
Your sleep graph is most useful not for comparing one night with an ideal shape, but for lining up many nights, learning what your own normal looks like, and noticing nights that stand out. In practice, keep these four things in mind:
- Look at many nights: sleep changes from night to night. Use the W or M view in the Health app, or the 14 days in the Sleep app on Apple Watch, and include both weekdays and days off. Apple’s paper also notes that habitual sleep duration, timing and how you perceive your sleep differ between people, and can change over time for the same person.
- Compare with how you felt in the morning: what matters more than the shape of the graph is whether you feel rested in the morning and how you do during the day. Japan’s Ministry of Health, Labour and Welfare also puts weight on the feeling of being rested by sleep. On nights you feel you barely slept, the graph sometimes shows more sleep than you expected (see What is sleep state misperception?).
- Record under the same conditions every night: Apple recommends wearing your Apple Watch at a comfortable fit. If it’s too loose, the accelerometer might register too much movement during your natural sleep. Keeping the fit the same and charging to at least 30% before bed makes it easier to compare one night with the next.
- Don’t chase the numbers: worrying too much about getting your graph to look “ideal” can itself become a source of anxiety and make it harder to sleep.
Reading your sleep graph in Sleepa
Our sleep app, Sleepa, reads the sleep data your Apple Watch writes to the Health app and shows each night as a graph (Sleepa doesn’t record sleep itself). As in the two nights above, it puts the following on a single timeline:
- Sleep stages: separate rows for In Bed (when there’s a record of your time in bed), Awake, REM, Core and Deep.
- Blood oxygen: your blood oxygen during sleep as blue dots, read against the 100%, 90% and 80% scale on the right.
- Sleep journal: your own sleep journal (a score out of 10 and how you spent each hour) under the graph on the same timeline, so you can compare how you felt with the data (see more about the sleep journal).
- The numbers: under the graph, you’ll find your bedtime and wake time, sleep time, sleep latency (how long it took to fall asleep), your blood oxygen range (lowest to highest), number of awakenings and time in each stage.
Tap another date on the home screen to compare many nights. Once you have at least 7 nights of data, tap “Analyze” to review your last 30 days. Its “Compared to your usual” section compares your last 7 days with your earlier records to see whether your sleep duration or sleep rhythm has changed. The analysis and the AI writing happen on your iPhone, and your sleep data is never sent to an outside AI service (more about the AI sleep analysis).
Sleepa’s analysis is not a diagnosis, and it can’t rule anything out. Sleepa also doesn’t show heart rate or respiratory rate; you can see those next to your sleep time under Comparisons in the Health app’s Sleep data. To use Sleepa, you need an Apple Watch that can measure blood oxygen (Series 6 or later, or Ultra) and an iPhone with iOS 26 or later. Apple Watch SE can’t measure blood oxygen, so it isn’t supported.
All Sleepa features are free for 7 days from the first time you open the app (you will not be charged automatically when the free period ends). To see what Sleepa adds compared with the iPhone’s built-in Health app, read What the Health app doesn’t tell you about your Apple Watch sleep data — 5 things Sleepa adds.
When to see a doctor
A sleep graph can’t tell you whether you have a medical condition, and Sleepa can’t diagnose one either. In the following cases, please see a doctor whatever your graph looks like. Your daily records will give you something concrete to talk about.
- Someone has told you that you snore loudly or stop breathing in your sleep
- You keep having nights when you can’t fall asleep, or wake up during the night or too early and can’t get back to sleep, and it’s affecting your daytime life
- Strong daytime sleepiness is interfering with work or driving
- Low blood oxygen readings (below 90%) keep appearing night after night
- You’ve been feeling low, or unable to enjoy anything, for a while
Frequently asked questions
What does a normal sleep graph look like?
A typical healthy adult’s sleep graph looks like a series of waves, with cycles of about 90 minutes repeating 4 to 6 times a night. Deep sleep comes mostly in the first half, REM periods get longer toward morning, and Core is the longest stage. A few brief awakenings scattered through the night are normal.
How do I read my Apple Watch sleep graph?
Rather than comparing one night with an ideal shape, read your Apple Watch sleep graph by lining up many nights, learning what your own normal looks like and noticing nights that stand out. Check whether short sleep, long awakenings at bedtime or toward morning, or big shifts in bedtime keep repeating, and compare the graph with how you felt.
Where can I see my sleep graph in the Health app on iPhone?
In the Health app on iPhone, tap Browse, then Sleep, to see your sleep graph, and tap W, M or 6M to switch to the past week, month or 6 months. Tap Show More Sleep Data, then Stages, to see the time and percentage you spent Awake or in REM, Core or Deep sleep.
What does a bad sleep graph look like?
There’s no set rule for what makes a sleep graph “bad,” and graphs that don’t match the typical shape are common. What’s worth a closer look is a pattern that keeps repeating night after night, such as short sleep, long awakenings at bedtime or toward morning, or a bedtime that shifts a lot from day to day.
Is it a problem if my graph shows little Deep sleep?
Little Deep sleep on your Apple Watch graph is not, on its own, a sign of a problem. The most common mistake Apple Watch makes is classifying true Deep sleep as Core, and in adults the share of deep sleep goes down with age.
Why does my sleep graph look like it’s mostly Deep sleep?
Deep sleep comes mostly in the first half of the night, so on a short night its share can look bigger than usual. A review of studies on alcohol and sleep also found that alcohol increases deep sleep in the first half of the night and disrupts sleep in the second half.
Key points
- A normal sleep graph looks like waves, with cycles of about 90 minutes repeating 4 to 6 times. Deep sleep comes mostly in the first half, and REM periods get longer toward morning
- Core is the longest stage, and a few brief awakenings scattered through the night are normal
- Real Apple Watch graphs are choppier than the schematic and vary from night to night, because of 30-second classification, estimation error, night-to-night changes and age
- Patterns worth a closer look are short sleep, long awakenings at bedtime or toward morning, shifting bedtimes, almost no Deep or REM, and broken-up sleep, when they keep repeating
- Don’t compare one night with an ideal shape. Line up many nights to learn your own normal, compare with how you felt, and see a doctor if you have symptoms that concern you
Sources: Apple, “Track your sleep on Apple Watch and use Sleep on iPhone” (Apple Support); Apple, “Estimating Sleep Stages from Apple Watch” (updated October 2025); Patel AK et al., “Physiology, Sleep Stages,” StatPearls; National Institute of Neurological Disorders and Stroke, “Brain Basics: Understanding Sleep“; Billings ME, “Interpreting Sleep Study Reports: A Primer for Pulmonary Fellows,” American Thoracic Society, 2014; Ohayon MM et al., “Meta-analysis of quantitative sleep parameters from childhood to old age in healthy individuals,” Sleep 27(7), 2004; Ebrahim IO et al., “Alcohol and sleep I: effects on normal sleep,” Alcohol Clin Exp Res 37(4), 2013; Drake C et al., “Caffeine effects on sleep taken 0, 3, or 6 hours before going to bed,” J Clin Sleep Med 9(11), 2013; Watson NF et al., “Recommended amount of sleep for a healthy adult,” Sleep 38(6), 2015; Ministry of Health, Labour and Welfare (Japan), “Sleep Guide for Health Promotion 2023” (in Japanese)
Sleepa — The Science of Sleep
Look back on the sleep your Apple Watch measures, together with AI sleep analysis and your sleep journal. Learn more about Sleepa.

* Requires an Apple Watch (Series 6 or later) and an iPhone with iOS 26 or later. AI text requires an iPhone that supports Apple Intelligence.
Please note: Sleepa is not a medical device. Its analysis is for reference only and is not a medical diagnosis. If you have symptoms that concern you or are worried about your sleep, please consult a medical professional.